SmartOS improves Node.js debugging experience (part 2)

This blog post is a two-parts series about debugging Node.js applications. The first part focuses on post-mortem debugging tools and practices, the second part illustrates how to debug latency bubbles in production using DTrace.

Debugging Node.js latency bubbles

Soft real-time systems

One thing that came out with Node.js is that it is extremely good for the new breed of applications: Internet facing, soft real-time systems.

A real-time system is one where the timeliness of the system is also its correctness, at some level. There is a clear distinction between hard real-time systems, where being late means failing, and soft real-time systems, where being late means systems just kind of “suck”.

With the rise of mobile, social and HTML5, we’ve seen more and more of this new breed of applications – DIRTy systems (data intensive real-time systems) – that are Internet facing, real-time systems that have a human in the loop. And when humans are in the loop the good news is that deadlines are soft (the system sucks but it doesn’t die – people will just complain), but the bad news is that the demand is typically non-linear.

Let’s imagine you’ve carefully built your real-time mobile application and suddenly a DJ from Cleveland tells all his listeners that they gotta go download your app and… boom! You get 100,000 people show up the same night, 400,000 more people at the end of the week and 1 million people at the end of the month. This happens, it has happened repeatedly, and it will happen again. We are seeing this trend accelerating, and the more computers will be in our pockets, the more we will have to cope with this.

And this is why it’s extremely difficult to deal with the challenge of scalability at the same time with the challenge of delivering data in real-time.

Debugging latency with DTrace

How do you debug these systems when they go wrong? How do you debug the latency bubbles that consist of failures in these kinds of systems?

Bryan Cantrill (@bcantrill) worked extensively in building real-time systems during his career and debugging them has always been a challenge for him. So he developed DTrace to dynamically instrument those systems, being able to walk them while they’re running, grabbing timestamps at different parts of the stack and correlating them to figure out where the latency is coming from.

The question was: how could we take DTrace into Node.js?

As was true for interpreting core dumps, in interpreted environments it’s extremely difficult to figure out from the bottom what is going on at the top of the stack. Bryan and team had a bunch of ideas and one of them was taken from other interpreted environments that instrument the actual VM wherever it’s doing a function call. It’s great and powerful (Erlang did a terrific job on that) but it is too fine grained.

Eventually, they decided to add USDT (Userland Statically Defined Tracing) probes at certain points of interests like HTTP requests, HTTP responses, GC and so on.

But how can we effectively use DTrace to debug our latency in Node.js? Let’s start by listing all the probes available for all my node processes by typing the following command in a SmartOS shell:

dtrace –n –l node*:::

And we’ll get an output like this:

SINDE Part 2 SC 1

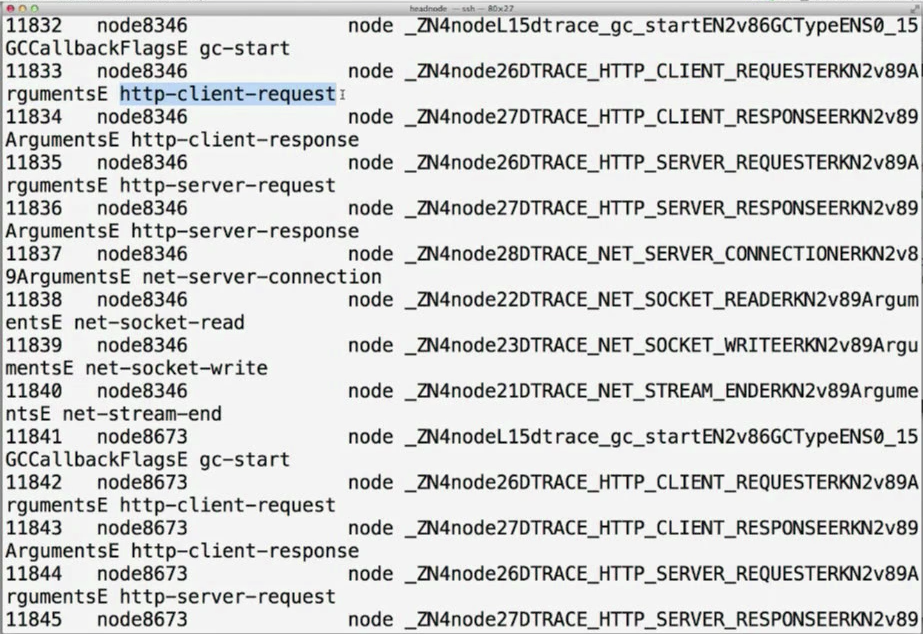
Apart from the C++ name mangling, you can actually see the points of interests (USDT probes) named http-client-request, http-client-response, etc.

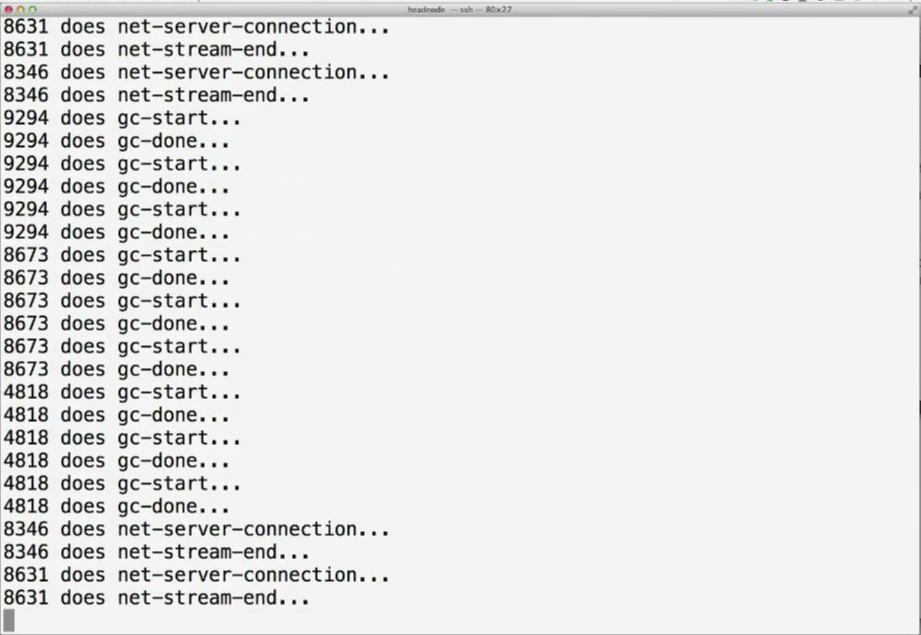
Let’s go enable all of them so that we can see in real time what our node processes are doing.

[root@23c5d173-9973-4d7c-8935-46c6-23ef47a6 ~]# dtrace –n node*:::’{printf(“%d does %s…n”, pid, probename)}’ –q

On the left you can see the process IDs and on the right what they’re doing:

SINDE Part 2 SC 2

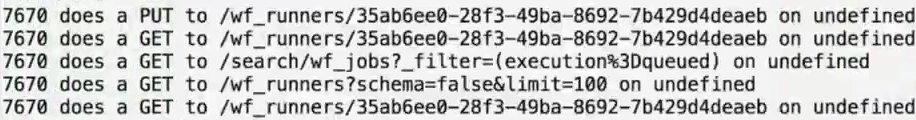
Let’s try to isolate the incoming HTTP activity by instrumenting only the http-client-request:

[root@23c5d173-9973-4d7c-8935-46c6-23ef47a6 ~]# dtrace –n http-client-request’{printf(“%d does a %s to %s on %s”, pid, args[0]->method, args[0]->url, args[1]->remoteAddress)}’ –q

And we get some more information out of it:

SINDE Part 2 SC 3

If we want to see the code actually executed upon HTTP requests, we can generate a stack trace whenever they occur by using the ustack() function:

[root@23c5d173-9973-4d7c-8935-46c6-23ef47a6 ~]# dtrace –n http-client-request’{printf(“%s:n”, args[0]->method); ustack()}’ –q

That prints out the stack backtrace:

SINDE Part 2 SC 4

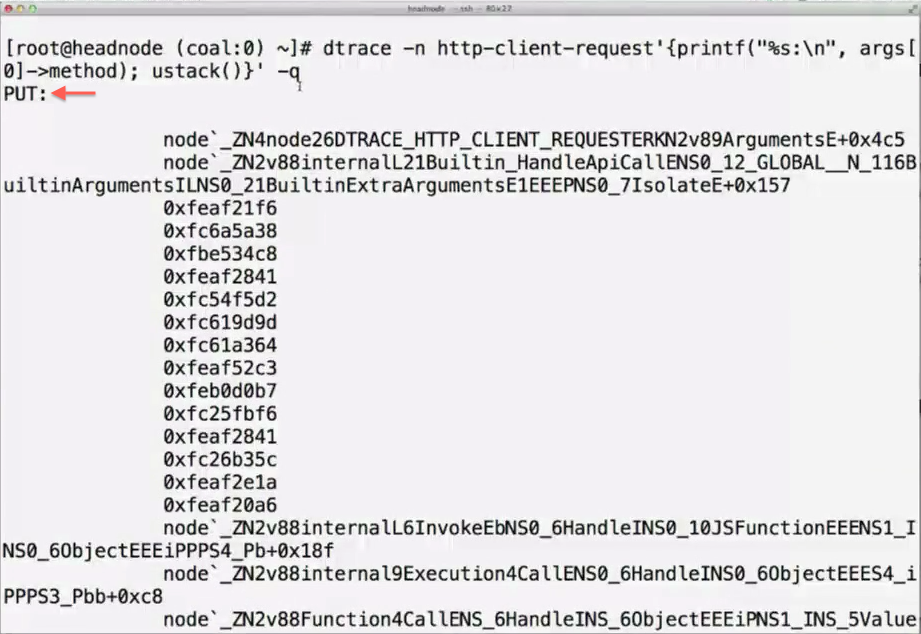
We printed the actual called method “PUT” (args[0]->method) and right after the stack trace of what was executed upon the request.

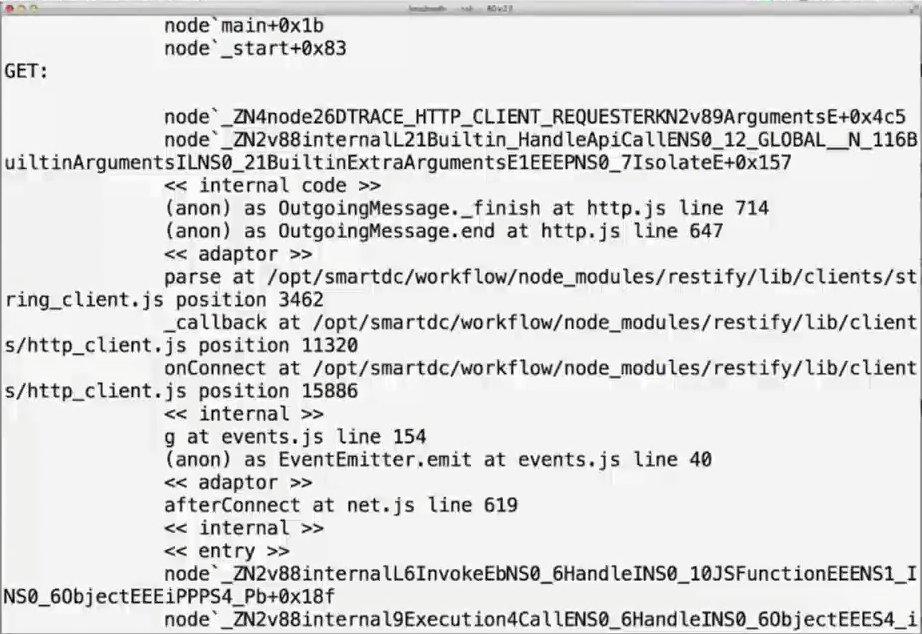
But we’re now back to the other problem: what the hell is this? Bryan and team were in front of another challenge: how to turn all of this into V8 frames from the context of the kernel?

And Dave Pacheco (@dapsays), who doesn’t know the definition of impossible (see part 1 of this blog post), has solved this for JavaScript environment. This is how: when V8 starts, it expresses in an intermediate representation how to take one of these frames and turn it into an actual string, and all of that is downloaded into the kernel upon start of the virtual machine. Then, whenever there is a stack trace generated, this time by the jstack() function, the map table is evaluated and frames are turned into proper readable ones.

[root@23c5d173-9973-4d7c-8935-46c6-23ef47a6 ~]# dtrace –n http-client-request’{printf(“%s:n”, args[0]->method); jstack()}’ –x jstrackstrsize=8k –q

Now we can see the actual JavaScript that was executed upon a GET:

SINDE Part 2 SC 5

As you may have realized, this is shining a very bright light to what was previously a total black hole. If you have a Node.js program misbehaving without this kind of technology you’re hosed.

During Node Summit back in January 2012, we heard practitioners talking about big problems of Node.js, and it was all about production debuggability. This is what Joyent has invested a lot into with SmartOS, even if the truth is that we did it to debug our own problems, and that’s true also for DTrace!

The remaining challenge was that USDT methodology was difficult to use with JavaScript. Fortunately, Chris Andrews developed the Node.js DTrace provider that allows you to define your own probes (the “points of interest”) entirely using JavaScript.

All of the above is available in Node.js since 0.6.7 and it’s there by default, you don’t have to do anything to enable it.

Visualizing latency

In terms of visualizing latency, another colleague from Joyent – Brendan Gregg (@brendangregg) – has done a terrific job. One of the most common problems is Node.js programs using too much CPU. Brendan hunted it by profiling the CPU at regular intervals, taking the stack traces, aggregating them by smashing the results together, re-sorting and displaying them as a “flame graph”:

SINDE Part 2 SC 6

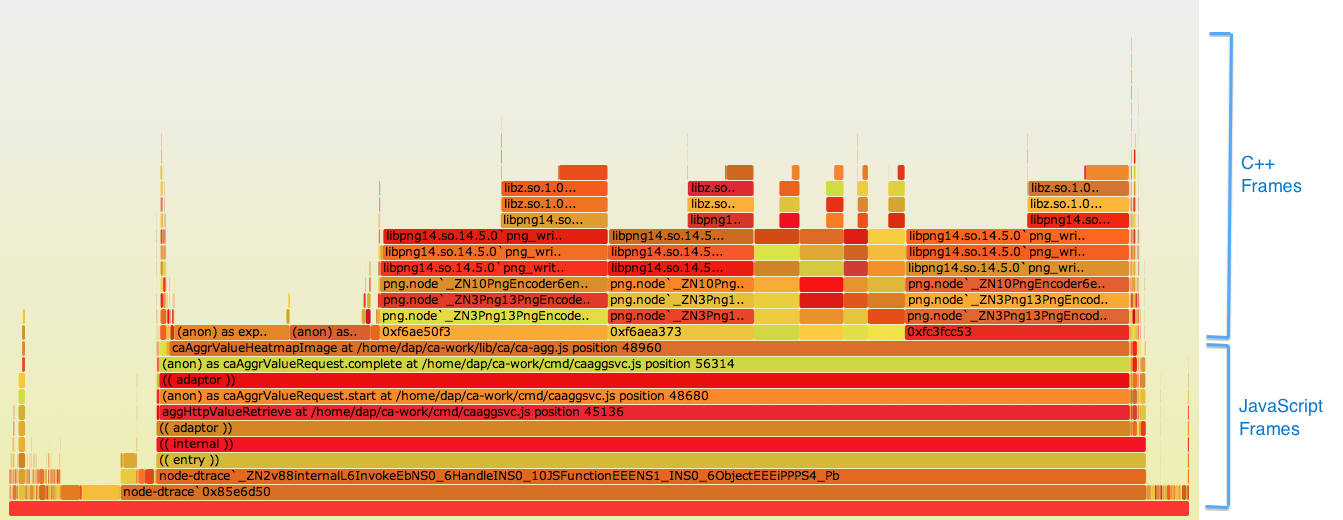
The stack shows both JavaScript and C++ frames in a way you can easily identify where your program is spending most of the CPU time. And it’s good to know is that all the tools to generate flame graphs are on GitHub and they’re open source, you can already use them in production to find important bugs or latency bubbles throughout your Node.js code.

Conclusion

SmartOS is Joyent’s foundation for the NodeStack, but Node.js runs everywhere. We, at Joyent are not binding Node.js to work only on a particular platform. We’re committed to invest further in SmartOS in a way to make it the natural choice for your production Node.js environment. And we’re going to do this by giving you great technology that allows you to understand your Node.js app in a way you can’t on any other platform.

SmartOS is an open-source project and it can be consumed as-a-service on top of the Joyent Public Cloud where all the above mentioned tools are enabled by default.

But now I would like to hear from you: how you debug your Node.js applications today? Do you consider debugging in production being one of the biggest Node.js challenges?

End of part 2. You can watch all NodeStack videos, including the one by Bryan Cantrill that was summarized here, by registering yourself for free on the conference website.

SmartOS improves Node.js debugging experience (part 1)

This blog post is a two-parts series about debugging Node.js applications. The first part focuses on post-mortem debugging tools and practices, the second part illustrates how to debug latency bubbles in production using DTrace.

Recently I was a spectator of one of the very first online conferences about the rise of a new software stack built for mobile and web applications. The new stack is NodeStack and is comprised of Node.js, MongoDB and SmartOS.  It is intended to replace the now surpassed LAMP stack, as modern applications have to deal with real-time response delivered at scale, required when interacting with an exploding number of mobile devices.

NodeStack conference featured a fabulous talk by Bryan Cantrill (@bcantrill), Joyent SVP of Engineering, going through why Joyent’s operating system, SmartOS, really makes a difference within the stack.  His points were so prescient, or His talk was so good that I decided to give my contribution translating it into this blog post. If debugging your Node.js apps in production sounds like a dream come true, read on!

SmartOS, the foundation of the NodeStack

Does the foundation really matter? It’s often very tempting to dismiss the foundation and concentrate on the appearance of things but, just like with buildings, the foundation is really critical and it doesn’t necessarily matter when things are working as much as when things fail.

When your program fails you need the foundation – the Operating System – to really understand what happened. When your component has failed, it’s gone and all that’s left is inside the Operating Systems, like footprints on what used to be the component.

Sir Maurice Wilkes, the father of computing, built the first stored program computer back in 1949. The first programmer in history already realized that it wasn’t easy to get programs right.

SINDE Part 1 SC 1

SmartOS is Joyent’s open-source operating system, it is a derivative of illumos, the community driven fork of OpenSolaris that was born when the project was made proprietary. It is backed by many former Sun Microsystems engineers, and it is built to be the operating system for the cloud. You may want to check out www.smartos.org to get more information.

Debugging Node.js logic failures

First off, programs fail for internal logic errors. A bug can cause them to die, exit improperly or end up in infinite loops. To debug these kinds of failures you often need tight integration with the underlying OS.

A real use case

To give real examples, Bryan speaks to his own experience, since Joyent builds its entire software for orchestrating their cloud using Node.js. In the past, Bryan and his team, including Ryan Dahl (the creator of Node.js) and Dave Pacheco (@dapsays), were hitting a black hole by experiencing a non-systematic infinite loop inside their application right before deploying in production.

They were looking at the generated stack, which looked like this:

SINDE Part 1 SC 2

Obviously, you have no idea where you are in the code.

They eventually deployed the application in production and even though they expected to see the bug happening immediately, they didn’t see it for months. And here comes the difference between an amateur and a professional: an amateur happily says “the bug just went away!” while the professional knows that the bug is there and will hit him in his weakest moment. In fact, the bug actually appeared when a customer was watching a demo of the software.

Bryan and team decided they would have to write something new to help debug the software.

mdb and v8.so

Historically, we have always looked at core dumps for post-mortem debugging. It’s a very old idea commonly used to debug operating systems, databases, web servers, etc. It is really great because it allows for asynchronous debugging: after a failure, you can restart your system immediately and debug it in parallel.

The problem is that this has not worked well in interpreted environments.

The challenge for Bryan and team was to add support for post-mortem debugging for Node.js. Bryan thought it was basically impossible because it implies you are able to reconstruct the VM state.  From the bottom of the system (the Operating System), it is very difficult to determine what is happening further up the stack. And this is reinforced by the fact that no one has done it satisfactorily so far, neither Java, nor Python, Ruby, Erlang or PHP.  Bryan thought it was an impossible problem to solve. Dave Pacheco proved him wrong.

Among the anecdotes contained in The Soul of a New Machine by Tracy Kidder, there is one about a college hire joining an engineering team.  The senior engineers didn’t have time to look after him, so they gave him an impossible problem to solve (a simulator), just to make him kill some time.  But he came back after a couple of months saying, “the simulator’s done”. To their surprise, the senior engineers realized they didn’t tell him it was an impossible problem. He solved it because he didn’t know it was impossible.

In the same way, Dave Pacheco solved the problem of visualizing a stack trace for interpreted environments. The result is that now we have the v8.so dmod for mdb that can be used for debugging Node.js programs post-mortem.

Let’s take a look at how it works.

[root@23c5d173-9973-4d7c-8935-46c6-23ef47a6 ~/dmod]# mdb corefile
> ::load v8.so
> ::jstack

After loading v8.so, the stack trace we have seen before looks like this, displaying all the actual JavaScript frames:

SINDE Part 1 SC 3

Now it is definitely much easier to identify that the source of the problem is inside the heatmap.js file.

But Dave went one step further. With his dmod, we can also take an arbitrary object and see what the actual arguments are, printed out as JSON. Now, if you look at the following output, you will notice something a bit suspicious, considering that the pathology was an infinite loop.

SINDE Part 1 SC 4

Note that “min” and “max” have the exact same value. The heatmap.js shouldn’t be called with such parameter values but, at the same time, the function should be able to handle this situation without generating an infinite loop. Both the caller and the called were fixed.

This is a concrete example of how to understand a production problem that couldn’t be debugged in any other way than with an effective post-mortem debugging tool.

Memory leaks

“Where is my memory going?” – during the broad adoption of Java in the mid 90’s, we’ve seen the rise of garbage collector problems. Since then, programmers still see their programs spending too much time doing GC. But that happens either because of actual garbage collection or because you’re actually not generating any garbage. In the second case, it means you’ve got a semantic leak: a data structure that you don’t care about that still has a reference somewhere and GC can’t collect it. You will focus on GC as the cause of the problem when it’s just a symptom of the problem. And it’s very easy to keep implicit references in JavaScript that result in heap growth that you don’t know where it’s coming from.

Walking the memory to find the source of leaks is not an easy task, but Dave helped solve another impossible problem. Bryan and team did it by scanning all memory looking for objects that were satisfying all the constraints that a proper JavaScript object should have.

The result is the ::findjsobjects mdb command, which scans the core file and prints out all the objects that are recognized and that can be visualized by piping their address into ::jsprint.

SINDE Part 1 SC 5

But to go hunting our memory leak source, we can even go further and print all JavaScript objects that match a certain object property signature.

> fc431cd1::findjsobjects | ::jsprint

End of part 1. To be continued here.

It’s already happening in Europe

Recently I’ve been reading an article about Europe being an unfriendly environment for entrepreneurship and specifically for startups. I liked the underlying optimism about getting a new beginning, but I think it is completely wrong to consider Europe as a whole when legislation and culture as so different country by country. And it is unfair not to see what Europe has already been doing so far.

Well then, where exactly the new beginning will start from? I’ve been trying to locate the hot spots for Internet startups in the Old Continent and I’ve actually seem much more than what is the common perception of this scenario.

New technologies are arising. Those that are specifically thought for the cloud, thought for scale. Internet and mobile applications frameworks and platforms (like Node.js, MongoDB) are getting more and more popular throughout the entire continent. Just look at the growing number of conferences such as Node Dublin, Node.js Conf in Italy, JSconf EU in Berlin or Railsberry in Krakow. And then notice they usually take place in weekends to let developers join out of their passion, leaving space to creativity and focusing on real innovation.

Moreover, it’s not only about startups. There are Internet companies in Europe that are already at the next stage. They developed a business model. They got profitable. And somebody believed in them, believed in the environment where they settled in and someone was eventually right doing that. Examples like SoundCloud (Germany), Spotify (Sweden), Wonga (UK), JustEat (Denmark) are just a few  that worth mentioning.

So is this just the new beginning? No, it is much more than that, it’s already happening and I really want to be there when that happens. I work for Joyent and we run a public cloud (IaaS) that hosts many of the successful Internet companies in the United States. Many of those have chosen Joyent because our technology is designed for those who make money through the Internet, for they who can’t afford loosing any click. Because one click means money.

But I live in Europe, and I want the next success story to be European.

This is what I work for everyday. I observe the evolving scenario of Internet companies in Europe, supporting conferences (I will be attending the Node Dublin, the most important European Node conference, next week) and helping companies driving their business in a better way by hosting their new generation applications in a new generation cloud. On top of an infrastructure that runs just fast as the bare-metal does, because it was built from the ground up, built with the cloud in mind.

It’s simply so exciting.

Cloud computing is not the evolution of virtualization

Many of you may probably think that after the success of virtualization technology they had to invent something appealing to keep pushing sales and they called it Cloud Computing. And the same people would think that cloud computing is just an extra layer on top of your virtualization management platform for better and coordinated resource management, that provides things like billing, machine catalogues, self-provisioning, etc.

Cloud Computing actually has a much wider meaning (that sometimes makes it simply look like a marketing trend) so today I will narrow it down and focus on cloud infrastructures. The questions I will try to answer are: what is a cloud infrastructure, and when can you say you’re really running your business in the cloud?

To provide the right answers, you have to think of the applications that you want to run on your IT infrastructure. Many of you have probably gone through the server consolidation process that made VMware a billion dollar company: you had lots unused hardware resources but you still wanted to separate operating environments so, no problem, hardware virtualization could solve that for you, without the need to change anything in your application code or architecture. The same application you were running before on the bare-metal would run exactly in the same way inside a virtual machine.

After server consolidation practices became common, somehow the evolution of hardware virtualization went much faster than the evolution of applications. Hypervisor vendors started to provide more and more features to make the underlying hardware always available for running applications, so they could endlessly run without even caring about potential hardware failures.

What people tend to forget when buying powerful hardware platforms is that application failures are much more the primary reason of outages than hardware failures. For this reason, sooner or later you realize that and you have to build up an application-level redundancy in order to implement a real highly available system. But with application-level redundancy, do you still need to have underlying expensive hardware? Why not to run your application on commodity servers?

This question will lead to the real concept of cloud computing. Let’s now try to give a definition: a cloud infrastructure can be called so if it:

  • is scalable and elastic
  • provides process automation (self-provisioning / self-service / billing)
  • is highly available
  • provides full multi-tenancy

And what is the purpose of all of the above? If you think carefully, you’ll realize that it’s all aimed at commoditizing the infrastructure itself. Companies shouldn’t spend anymore time to build up their IT foundations but they should concentrate on their actual business workflows, supported by really innovative applications. Infrastructure is something they want to take for granted.

In this scenario, a cloud platform should have another important characteristic: it has to be cheap.

So can you achieve all of that with a traditional hardware virtualization-powered infrastructure? No.

Scalability will be an issue if you’re using centralized resources (that can’t grow big forever) that are usually necessary for providing hardware-level HA.

You will feel safe thanks to all those automatic live machine migration features but don’t forget that they protect you only from hardware failures. If the application fails there is not much they can do for you. You should protect yourself from application failures by building a redundant application architecture but, if you do so, do you still need expensive hardware-level HA? No, you don’t.

And one more thing, cost. Hardware virtualization infrastructures require complex high-end hardware that won’t get the point of being cheap in order to turn the IT infrastructure into a commodity.

In the end, do you want to run your old legacy application in the cloud? Forget it. Just keep it on your powerful expensive virtualization platform. That will work just fine. But if you’re a visionary who believes in a future that requires performant, scalable, elastic and cheap commodity IT infrastructures, then choose your next applications to be cloud aware. That will take you much further, much faster.

New blogger is around

When blogs are no longer trending – except for automatic social-media/seo eco-systems generators – I decided to set up my own. I’m neither nostalgic nor retro, I just think that now more than ever it is important to help people understand real values and make some order in the tons of information we get daily, literally “big data” that is mainly generated and driven by marketing engines.

Today, IT decision makers are puzzled about which technology would boost up their business and most of them end up just picking mainstream products because “you won’t ever get fired for buying $marketLeader”. I always believed technology can really help the economy by commoditizing processes and leaving companies to focus on their core business, but if everyone picks mainstream technology products, how can competition rise through innovation?

In this blog I’ll try to give my contribution for a better understanding of the key technology trends I’m working on, aiming at helping anyone taking the right long term decision, possibly not in a conservative way.

Stay tuned!